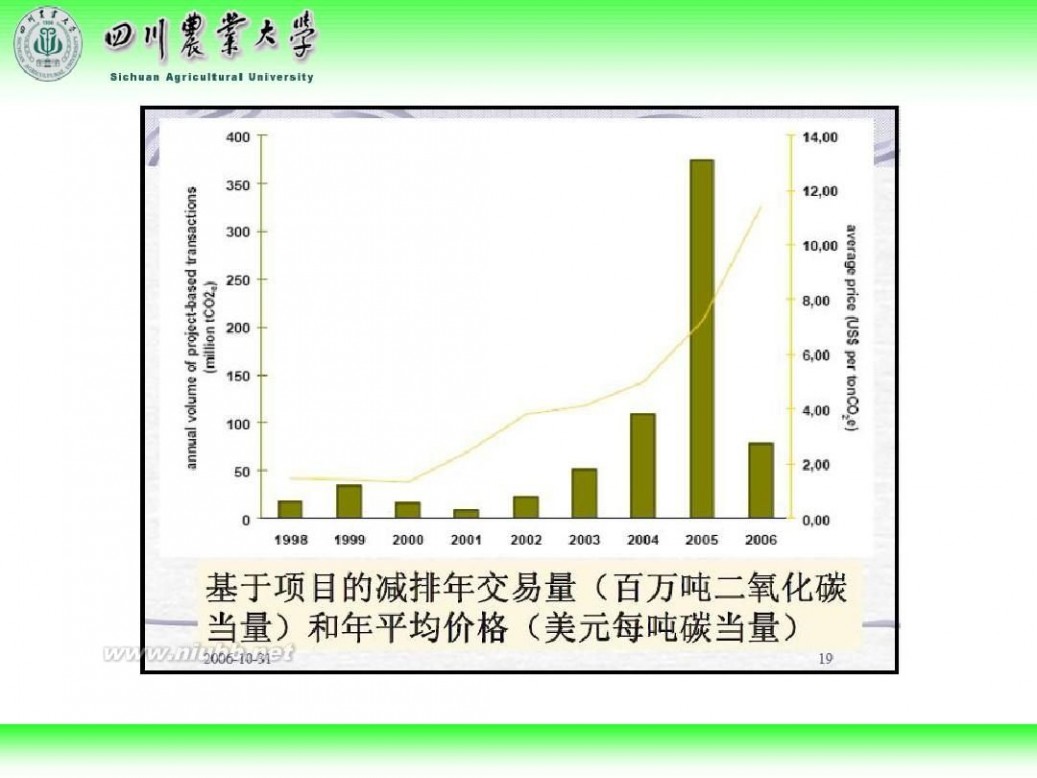
一 : 四川农业大学李明洲nature文章
ARTICLE
Received 7 oct 2011 | Accepted 19 Apr 2012 | Published 22 may 2012DOI: 10.1038/ncomms1854
An atlas of DnA methylomes in porcine adipose and muscle tissues
mingzhou Li1,*, Honglong Wu2,*, Zonggang Luo1,3, Yudong Xia2, Jiuqiang Guan1, Tao Wang1, Yiren Gu4, Lei Chen5, Kai Zhang1,?, Jideng ma1, Yingkai Liu1, Zhijun Zhong1, Jing nie1, shuling Zhou1, Zhiping mu1,
Xiaoyan Wang1, Jingjing Qu1, Long Jing1, Huiyu Wang1, shujia Huang2, na Yi2, Zhe Wang2, Dongxing Xi2,
Juan Wang2, Guangliang Yin2, Li Wang2, ning Li2, Zhi Jiang2, Qiulei Lang6, Huasheng Xiao7, Anan Jiang1, Li Zhu1, Yanzhi Jiang1, Guoqing Tang1, miaomiao mai1, surong shuai1, ning Li8, Kui Li9, Jinyong Wang5, Xiuqing Zhang2, Yingrui Li2, Haosi Chen10, Xiaolian Gao10, Graham s. Plastow11, stephen Beck12, Huanming Yang2, Jian Wang2, Jun Wang2, Xuewei Li1 & Ruiqiang Li2,?
It is evident that epigenetic factors, especially DnA methylation, have essential roles in obesity
development. Here, using pig as a model, we investigate the systematic association between
DnA methylation and obesity. We sample eight variant adipose and two distinct skeletal muscle
tissues from three pig breeds living within comparable environments but displaying distinct fat
level. We generate 1,381 Gb of sequence data from 180 methylated DnA immunoprecipitation
libraries, and provide a genome-wide DnA methylation map as well as a gene expression
map for adipose and muscle studies. The analysis shows global similarity and difference
among breeds, sexes and anatomic locations, and identifies the differentially methylated
regions. The differentially methylated regions in promoters are highly associated with obesity
development via expression repression of both known obesity-related genes and novel genes.
This comprehensive map provides a solid basis for exploring epigenetic mechanisms of adipose deposition and muscle growth.
1 Institute of Animal Genetics and Breeding, College of Animal Science and Technology, Sichuan Agricultural University, Ya’an, Sichuan 625014, China. 2 BGI-Shenzhen, Shenzhen, Guangdong 518083, China. 3 Department of Animal Science, Southwest University at Rongchang, Chongqing 402460, China. 4 Sichuan Animal Science Academy, Chengdu, Sichuan 610000, China. 5 Chongqing Academy of Animal Science, Chongqing 402460, China. 6 LC-Bio, Hangzhou, Zhejiang 310018, China. 7 National Engineering Center for Biochip at Shanghai, Shanghai 201203, China. 8 State Key Laboratory for Agrobiotechnology, China Agricultural University, Beijing 100193, China. 9 Institute of Animal Science, Chinese Academy of Agricultural Sciences, Beijing 100193, China. 10 Department of Biology and Biochemistry, University of Houston, Houston, Texas 77004-5001, USA. 11 Department of Agricultural, Food and Nutritional Science, University of Alberta, Edmonton, Alberta AB T6G 2P5, Canada. 12 Medical Genomics, UCL Cancer Institute, University College London, London WC1E 6BT, UK. *These authors contributed equally to this work. ?Present addresses: Sichuan Academy of Grassland Science, Chengdu, Sichuan 610000, China (K.Z.); Peking-Tsinghua Center for Life Sciences, Biodynamic Optical Imaging Center and School of Life Sciences, Peking University, Beijing 100871, China (R.L.). Correspondence and requests for materials should be addressed to X.L. (email: xuewei.li@sicau.edu.cn) or to R.L.
(email: lirq@pku.edu.cn).
nATuRE CommunICATIons | 3:850 | DoI: 10.1038/ncomms1854 | www.61k.comaturecommunications??
? 2012 Macmillan Publishers Limited. All rights reserved.
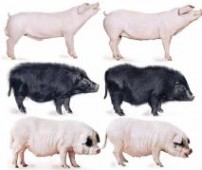
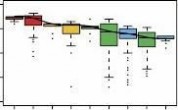
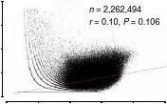
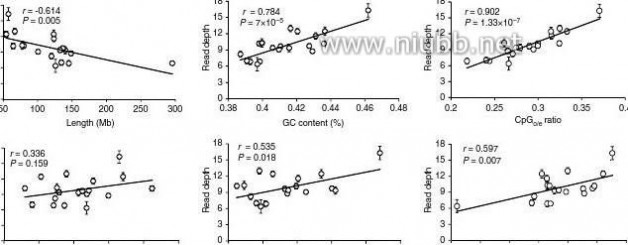
ARTICLEnATuRE CommunICATIons | DoI: 10.1038/ncomms1854Obesity can be considered an epidemic that has become a major threat to the quality of human life in modern society1. By 2030, up to 58% of the world’s adult population might be either overweight or obese1. Adipose tissues (ATs) and skeletal muscle tissues (SMTs) have important roles in the pathogenesis of obesity and its comorbidities by secreting cytokines involved in the regulation of metabolism2,3. The metabolic risk factors of obesity and increased body weight are more related to adipose distribu-tion rather than the total adipose mass4,5. ATs located within the abdominal and thoracic cavity, known as visceral ATs (VATs), have been recognised to be anatomically, functionally and metabolically distinct from that of the compartmental subcutaneous ATs (SATs)6, and have been found to be related to a series of diseases, including cardiovascular disease, type II diabetes mellitus and metabolic syn-drome7. Nonetheless, SATs can have direct and beneficial effects on the control of body weight and metabolism8.Pig (Sus scrofa) is emerging as an attractive biomedical model for studying energy metabolism and obesity in humans, because of their similar metabolic features, cardiovascular systems, propor-tional organ sizes and lack of brown adipose postnatally9. The pig model offers, in fact, the advantages of low genetic variance, homo-geneous feeding regime and remitting confounding factors typical of humans, such as smoking, alcohol drinking and so on. In the modern industry, pigs have undergone strong genetic selection in the relatively inbred commercial lines for lean meat production, or in some cases, for adipose production, which has led to remarkable phenotypic changes and genetic adaptation, making these breed lines a perfect model for comparative studies10,11.There has been extensive research to hunt for ‘obesity alleles’, most recently by whole-genome association studies12,13. It is evident that DNA sequence polymorphism alone does not provide adequate explanations for mechanisms of obesity regulation. Recently, epige-netic factors, especially DNA methylation that is a stably inherited modification affecting gene regulation and cellular differentiation, has gained a greater appreciation as an alternative perspective on the aetiology of complex diseases14,15. Nevertheless, current under-standing of the roles of DNA methylation in the aetiology of obesity remains fairly rudimentary16.Here, for three well-defined pig breeds displaying distinct fat contents in comparable environments, we collected eight ATs from different body sites and two phenotypically distinct SMTs, and studied genome-wide DNA methylation differences among breeds, sexes and anatomic locations. We showed the landscape of methy-lome distribution in the genome, analysed differentially methyl-ated regions (DMRs) and identified genes that were involved in the development of obesity. The work performed here will serve as a valuabl e resource for future functional validation and aid in search-ing for epigenetic biomarkers for obesity prediction and prevention, and promoting further development of pig as a model organism for human obesity research.indicators in serum also revealed the same ranking (Supplementary Fig. S1).To study adipocyte regulation in different anatomic locations, we sampled eight ATs from various body regions (Fig. 1b), which exhibited dissimilar fatty acid composition (Fig. 1c) and significantly different adipocyte volumes (three-way ANOVA, PT = 6.74×10 ? 12) among the three breeds (three-way ANOVA, PB < 10 ? 16), and between males and females (three-way ANOVA, PS = 10 ? 16; Fig. 1d; Supplementary Fig. S2). We also sampled two SMTs, white longissimus dorsi muscle (LDM) and red psoas major muscle (PMM; Fig. 1b), representing two different fibre types, of which PMM has a higher percentage of capillaries, myoglobin, lipids and mitochon-dria17. Compared with PMM, LDM has higher myofibre cross- sectional area (three-way ANOVA, PT = 9.66×10 ? 12; Fig. 1e; Supple-mentary Fig. S2) and ratio of fast to slow twitch myofibre (three-way ANOVA, PT < 10 ? 16; Fig. 1f; Supplementary Fig. S2). There is also significant divergence in myofibre cross-sectional area (three-way ANOVA, PB < 10 ? 16, PS = 0.005) and myofibre type ratio (three-way ANOVA, PB = 4.42×10 ? 10, PS = 5.45×10 ? 9) among the three breeds and between the two sexes. These phenotypic differences for ATs and SMTs between breeds, sexes and anatomic locations imply the intrinsically epigenomic differences.Landscape of the DNA methylomes. We generated a total of 1,381 Gb methylated DNA immunoprecipitation sequenc-ing (MeDIP-seq) data from 180 samples (~7.67 Gb per sample), of which 1,067 Gb (77.3%) clean reads were aligned on the pig genome. After removing the ambiguously mapped reads and reads that may have come from duplicate clones, we used 993 Gb (71.9%) uniquely aligned non-duplicate reads in the following analysis (Sup-plementary Table S1). To avoid false positives in enrichment, we required at least ten reads to determine a methylated CpG in a sam-ple. On average, 16.1% of the CpGs were covered by this threshold (Supplementary Fig. S3).Measurement of DNA methylation level along chromosomes showed that the X chromosome is globally hypermethylated in females compared with males (Fig. 2a), which can be explained by the X chromosome inactivation in females18. Through comparison of DNA methylation level between each pair of samples, we found variable correlation rates in different categories (Fig. 2b). The bio-logical replicates highly correlated with each other (median Pear-son’s r = 0.95 for SMTs and r = 0.94 for ATs), which suggested both experimental reliability and epigenetic consistency within the same breed/sex/tissue type group. The correlation rates were relatively lower between male and female (median Pearson’s r = 0.92 for SMTs and r = 0.91 for ATs), and even lower between different anatomic locations (median Pearson’s r = 0.91 for SMTs, r = 0.89 for between ATs and SMTs, and r = 0.87 for ATs) and between different breeds (median Pearson’s r = 0.88 for ATs and r = 0.84 for SMTs), indicating significant biological differences in the latter categories.We observed that methylation level correlates negatively with chromosome length (Pearson’s r = ? 0.614, P = 0.005) and positively with GC content (Pearson’s r = 0.784, P = 7×10 ? 5), repeat density (Pearson’s r = 0.336, P = 0.159), gene density (Pearson’s r = 0.535, P = 0.018), and especially with observed over expected number of CpG (CpGo/e) ratio (Pearson’s r = 0.902, P = 1.33×10 ? 7) (Fig. 3a), which is consistent with previous reports19. More detailed analysis showed that the regions with GC content around 46% and CpGo/e ratio around 0.35 tend to have a higher methylation level (Fig. 3b,c), where the average GC content in the pig genome is 40% and CpGo/e ratio is 0.21 (Fig. 3d,e). Nonetheless, there is no significant cor-relation between the GC content and CpGo/e ratio on a genomic scale (Pearson’s r = 0.10, P = 0.106; Fig. 3f). The analysis showed that CpGo/e ratio has a higher correlation rate with DNA methyla-tion level than with GC content. Single-nucleotide polymorphism (SNP) density also positively correlated with the methylation level ResultsSamples and their obesity-related phenotypes. We chose three pig breeds in this study, based on known history of breed formation and measurement of obesity-related phenotypes (see Supplementary Methods). The Landrace breed has been selected for less adipose for more than 100 years in Europe, whereas the Rongchang breed was selected for extreme adipose. The Tibetan breed is almost a feral breed that has undergone very little artificial selection. On average, adult females exhibit higher fat percent than males upon reaching sexual maturity at 210 days old. To investigate sexual differences, we also separated males and females in the comparison. As expected, body density, which negatively correlates with fat percent, showed significant difference among the three breeds (two-way analysis of variance (ANOVA), PB = 6.98×10 ? 10) and between male and female (two-way ANOVA, PS = 0.02; Fig. 1a). Measurement of metabolism
????nATuRE CommunICATIons | 3:850 | DoI: 10.1038/ncomms1854 | www.61k.comaturecommunications
? 2012 Macmillan Publishers Limited. All rights reserved.
nATuRE CommunICATIons | DoI: 10.1038/ncomms1854
ARTICLE
PB = 6.98 × 10⁻¹⁰PS = 0.02PB × S = 0.08LM
SMTs
ULB
LF
ILB
SATs
TM
ASA
TF
PAD
RM
AbdominalThoracic
VATs
RFDensity (kg·l–1)


0.30.60.91.2
SFA
Fatty acid composition(g.100g–1)

1.00.80.60.40.20
MUFAPUFA
Adipocyte volume(×103 μm3)
Myofibre cross-sectionalarea (μm2


)
Myofibre type ratio(Fast/slow)
LDPMPMLD

MADGOMRADPADIADASAILBULBMADGOMRADPADIADASAILBULBMADGOMRADPADIADASAILBULBMADGOMRADPADIADASAILBULBMADGOMRADPADIADASAILBULBMADGOMRADPADIADASAILBULB
GOILRAPAASLMLFTMTFRMRFSATVATs
Figure 1 | Characteristics of pig ATs and SMTs. (a) Body density difference among Landrace (L), Tibetan (T) and Rongchang (R) pigs, and between male (m) and female (F). Two-way repeated-measures AnoVA (n = 9 per breed per sex). ‘B’ and ‘s’ mean breed and sex, respectively. Values are means ± s.d. (b) sources of tissues: three sATs (AsA: abdominal subcutaneous adipose, ILB: inner layer of backfat, uLB: upper layer of backfat), four VATs (Gom: greater omentum, mAD: mesenteric adipose, RAD: retroperitoneal adipose, PAD: pericardial adipose), intermuscular adipose (IAD) and two smTs (LDm: longissimus dorsi muscle, and Pmm: psoas major muscle). (c) Fatty acid composition difference. sFA, muFA and PuFA mean saturated, monounsaturated, and polyunsaturated fatty acid, respectively. Three-way repeated-measures AnoVA (n = 9 per breed per sex per tissue). (sFA: PB = 2.46×10 ? 7, Ps = 1.35×10 ? 6, PT = 0.99, PB×s = 0.19, PB×T = 0.96, Ps×T = 0.69, PB×s×T = 0.77; muFA: PB = 0.006, Ps = 0.0004, PT = 0.98, PB×s = 0.99, PB×T = 0.99, Ps×T = 0.93, PB×s×T = 0.77; and PuFA: PB = 0.0008, Ps = 0.14, PT = 0.98, PB×s = 0.03, PB×T = 0.99, Ps×T = 0.56, PB×s×T = 0.099). (d) Adipocyte volume difference. Three-way repeated-measures AnoVA (n = 9 per breed per sex per tissue). ‘T’ means tissue. (PB < 10 ? 16, Ps = 10 ? 16, PT = 6.74×10 ? 12, PB×s < 10 ? 16, PB×T = 0.29, Ps×T = 0.36, PB×s×T = 0.99). Values are means ± s.d. (e) myofibre cross-sectional area difference. Three-way repeated-measures AnoVA (n = 9 per breed per sex per tissue; PB < 10 ? 16, Ps = 0.005, PT = 9.66×10 ? 12, PB×s = 0.44, PB×T = 0.01, Ps×T = 0.583, PB×s×T = 0.07). (f) myofibre type ratio difference. Three-way repeated-measures AnoVA (n = 9 per breed per sex per tissue; PB = 4.42×10 ? 10, Ps = 5.45×10 ? 9, PT < 10 ? 16, PB×s = 0.004, PB×T = 0.02, Ps×T = 1.61×10 ? 5, PB×s×T = 0.04).
(Pearson’s r = 0.597, P = 0.007; Fig. 3a). Although substantial associ-ation of SNP density and DNA methylation level has been found20, the mechanism is still unclear. Furthermore, the gene-rich subte-lomeric region (7 Mb from each telomere) has significantly higher methylation in most (~80%, 15 out of 19) chromosomes (Student’s t-test, P < 0.01; Fig. 3g).
Characterisation of DMRs. We used statistics to measure the meth-ylation rate changes and defined DMRs across breeds (B-DMRs), sexes (S-DMRs) and tissues (T-DMRs; see Supplementary Meth-ods). The high correlattion (average Pearson’s r = 0.994) between the number of DMRs, the number of CpGs in DMRs and the length of DMRs implied that DMR detection in regions of different length and its embeded number of CpGs was non-biased. The number of DMRs varied considerably between categories (for example, 387 muscle S-DMRs versus 218,623 muscle B-DMRs; Table 1).
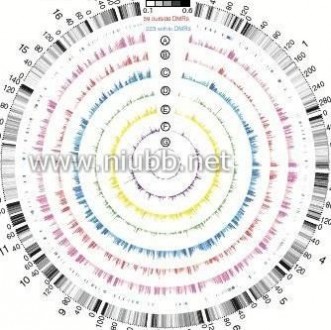
A macroscopical display of DMRs along chromosomes shows that DMR-rich regions also predominantly have higher CpGo/e ratios (~0.35) than the genomic average (0.21; Fig. 4a). Over 20% of DMRs are located in subtelomeric regions, which only occupy 11.76% of the whole genome. Among the 282 pig genes that were orthologs to known human obesity-related genes2,12,13,21, 223 (~80%) were within our defined DMRs (Fig. 4a; Supplementary Data 1 and 2), which suggested that the DMRs have high associa-tion with the known obesity-related genes and these genes may have functional roles in obesity development by ways of methylation rate changes.
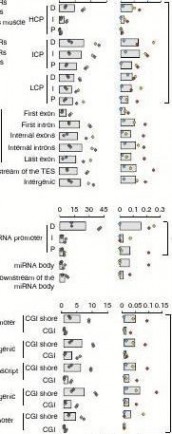
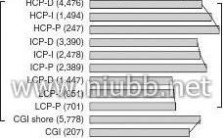
We then looked at DMRs in the 31 categories of functional genomic elements. We separated promoters into three types accord-ing to the CpG representation as previously described22 (Fig. 4b), and also classified CpG islands (CGIs) into five classes according to their genomic locations as previously described23 (see Methods; Fig. 4c). DMRs occur more frequently in intermediate CpG pro-moter (ICP) than in high CpG promoter (HCP) and low CpG pro-moter (LCP) regions (two-way ANOVA, P = 0.056; Fig. 4d). The ICP class contains many weak CGIs24 ( < 500 bp, have moderate CpG richness and/or have a GC content below 55%). This result validated previous findings that weak CGIs are more predisposed to regula-tion by DNA methylation and preferential targeting of weak CGIs is a general phenomenon in mammals22. Promoter hypermethylation has a critical role in suppressing gene expression, yet in gene bodies, it is also important in regulating alternative promoters and prevent-ing spurious transcription initiation23. Interestingly, the first exon regions have the lowest DMRs within the gene body (Fig. 4d), which may be because of some functional motifs overlapping between the proximal region of promoters and first exons. In addition, the dis-tal (D) regions of both mRNA and microRNA (miRNA) promoters have more DMRs than the intermediate (I) and proximal (P) regions (Fig. 4d), suggesting that changes in methylation at D regions of promoters may be a more prevalent mechanism for producing

??
nATuRE CommunICATIons | 3:850 | DoI: 10.1038/ncomms1854 | www.61k.comaturecommunications
? 2012 Macmillan Publishers Limited. All rights reserved.
MAULIA
ARTICLE
CpGo/e ratio
400
0.1
0.6
5 M
RepeatSNP

GeneCGI
nATuRE CommunICATIons | DoI: 10.1038/ncomms1854
Chromosome 1
400
Chromosome 2
SMTsATs
400
Chromosome 3400
Chromosome 4400
Chromosome 5
400
Chromosome 6400
Chromosome 7400
Chromosome 8
400
Chromosome 9
400
Chromosome 10
400
Chromosome 11
400
Chromosome 12
400
Chromosome 13
400
Chromosome 14
400
Chromosome 15
400
Chromosome 16400
Chrom——www.61k.com——osome 17
400
Chromosome 18
10.90.80.70.6

400
Chromosome X

ATs
Correlation
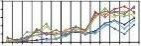
Figure 2 | Chromosomal profiles of pig ATs and SMTs methylomes and their variability. (a) Distribution of DnA methylation level on the pig genome. To compare DnA methylation rates among samples, read depth was normalised by overall average amount of reads in each group, and then a 1 mb sliding window was used to smooth the distribution. The CpGo/e ratio, density of snP, gene, repeat and CGI were all calculated by 1 mb sliding window.
(b) Boxplots of pairwise Pearson’s correlation on methylation rate between samples. The correlation rate between every two samples was calculated by 1 kb sliding window. Then these correlation rates were grouped into the following categories: biological replicates, the same sex, the same tissues, the same breeds and between adipose and muscle tissues. As X chromosome has obviously higher methylation level in female than in male, we excluded it in the analysis between sexes. Boxes denote the interquartile range (IQR) between the first and third quartiles (25th and 75th percentiles, respectively) and the line inside denotes the median. Whiskers denote the lowest and highest values within 1.5 times IQR from the first and third quartiles, respectively. outliers beyond the whiskers shown as black dots.
transcriptional variability. We found that most DMRs are located in CGI shores rather than in CGIs (Fig. 4d) in all five classes of genomic elements (two-way ANOVA, P = 0.002), which is consist-ent with previous reports25–27. CpGo/e ratio of most CGI shores is around 0.35–0.36, whereas CGIs have CpGo/e ratios far greater than this cutoff (Wilcoxon rank-sum test, P < 10 ? 16; Fig. 4e), as shown by the plot of reads distribution against CpGo/e ratio in Fig. 3c.Promoter methylation and transcriptional repression. We explored the correlation between methylation rate in promot-ers and expression level of associated mRNAs and miRNAs (Fig. 5; Supplementary Fig. S4). It is believed that DNA methylation in promoters is only one of the several mechanisms for regulating gene expression; hence, it is logical that not all genes have corre-lated methylation and expression patterns. The order of correlation
????
level in mRNA promoters, from high to low, was HCP, ICP, LCP and P, I, D (Fig. 5), which validated previous report28. Nonethe-less, as DMRs are enriched in ICPs and D regions of promoters (Fig. 4d), there were more mRNA-DMR pairs exhibiting correlation in ICP (8,257) than in HCP (6,217) and LCP (3,099), and more pairs in the D region (9,313) than in the I (4,923) and P (3,337) regions (Fig. 5). Further, it indicated that the CpG content difference of pro-moters has a more profound impact on mRNA expression (two-way ANOVA, P = 5.56×10 ? 4) than the distance to transcription start site (TSS) of the regions in promoters (two-way ANOVA, P = 0.07).There was correlation between miRNA expression and methyla-tion rate in P regions of miRNA promoters (Pearson’s r = ? 0.368, P = 4.44×10 ? 8), but almost no correlation in I (Pearson’s r = ? 0.116, P = 0.146) and D (Pearson’s r = 0, P = 0.996) regions of miRNA pro-moters (Supplementary Fig. S4). Primary miRNA transcripts can
nATuRE CommunICATIons | 3:850 | DoI: 10.1038/ncomms1854 | www.61k.comaturecommunications
? 2012 Macmillan Publishers Limited. All rights reserved.
(atmuesscSe (adle)xeiposSe (mse)xeusclBeTiss (e)astwuedi
eespon (sm admue)usipscBrcleosle)ee tie Tidsssuandss (aeuedisspBr (aoseeedip)ods (mse)uscle)lic
epR
R
ep
lic
at
es
nATuRE CommunICATIons | DoI: 10.1038/ncomms1854
ARTICLE
Read depth
Read depth
Repeat number / kb
Gene number / Mb
SNP number / Mb
% of total reads
% of total reads
–0.3610n = 2,262,494Median = 40.2Range (0–85.2)
GC content (%)Whole genome
CpGo/e ratio
n = 2,262,494 Median = 0.21Range ( 0–333.33)
Whole genome
0–6–o/eCpGo/e ratio
Read depth
Non-subtelomeric regionSubtelomericGC content (%)
234578
9101112Chromosome
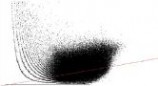
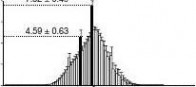
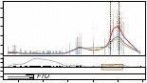
131415161718Figure 3 | DNA methylation level with genomic features. (a) The Pearson’s correlation between DnA methylation level and features of pig autosomes (chromosomes 1–18) and sex chromosome X. The read depth was plotted against the length, GC content, repeat density, gene density, CpGo/e ratio and snP density of individual chromosome. Line represents linear regression. Values are means ± s.d (n = 180). (b–e) sequencing reads distribution against CpGo/e ratio and GC content. Reads distribution against (b) GC content and (c) CpGo/e ratio over all samples. Values are means ± s.d (n = 180). Box plot of (d) GC content and (e) CpGo/e ratio of the whole genome in 1 kb windows. Boxes denote the interquartile range (IQR) between the first and third
quartiles (25th and 75th percentiles, respectively) and the line inside denotes the median. Whiskers denote the lowest and highest values within 1.5 times IQR from the first and third quartiles, respectively. outliers beyond the whiskers shown as black dots. The 46–47% GC content and 0.35–0.36 CpGo/e ratio are corresponding to the maximal % of total reads, that is, 7.52 ± 0.49 and 2.03 ± 0.07%, respectively. The genomic median of GC content (40–41%) and CpGo/e ratio (0.21–0.22) are corresponding to 4.59 ± 0.63 and 1.50 ± 0.17% of total reads, respectively. (f) GC content versus CpGo/e ratio plot of 1 kb windows across the pig genome. The pig genome was divided into 2,262,494 windows of 1 kb, and the windows were used to calculate the Pearson’s correlation coefficient (r) between the GC content and CpGo/e ratio. Red line represents linear regression. (g) methylation levels in subtelomeric (up to 7 mb from each telomere) and non-subtelomeric regions in each chromosome. (student’s t-test, **P < 0.01). Values are means ± s.d (n = 180).
be several thousand bases long and embeds a ~70 nucleotide long stem-loop precursor (pre-miRNA)29. Although little is known about the TSS of primary miRNA transcripts30, the results here suggested that DNA methylation in 5′ upstream of pre-miRNAs could have a role in transcriptional silencing of mature miRNA.
Methylation in CGI shores had stronger (Pearson’s r = ? 0.146, P = 6.15×10 ? 29) correlation with mRNA expression than in CGIs (Pearson’s r = ? 0.128. P = 0.066; Supplementary Fig. S4), which is consistent with previous studies25–27. Nonetheless, miRNA expres-sion has little or no correlation with CGI (Pearson’s r = ? 0.133, P = 0.241) and CGI shore methylation (Pearson’s r = 0.099, P = 0.268). A recent study also showed that a common feature of DNA
methylation-repressed miRNAs is the absence of CGIs in the
31promoter region.
Promoter DMRs best discriminate breeds and tissues. To ana-lyse whether DMRs exhibit any breed, sex and/or anatomic loca-tions specific pattern, we performed unsupervised clustering for
all samples using DMRs of each category of genomic elements. The adipose and muscle B-DMRs in promoters were well clustered by breed (Fig. 6a,b). Clustering of samples by corresponding mRNA expression is generally similar (Supplementary Fig. S5), indicating consistent relationships between DNA methylation in the promoters
and gene expression. The clustering by B-D MRs in CGI shores can


??
nATuRE CommunICATIons | 3:850 | DoI: 10.1038/ncomms1854 | www.61k.comaturecommunications
? 2012 Macmillan Publishers Limited. All rights reserved.
ARTICLE
nATuRE CommunICATIons | DoI: 10.1038/ncomms1854group most samples from each breed, but not as distinctly as that by B-DMRs in promoters. This suggested that, although methylation in CGI shores is important in regulating gene expression25–27, meth-ylation differences at promoters are better predictors of differences among the breeds. The clustering by B-DMRs of other genomic elements is even less distinct, suggesting that most methylation in these genomic elements may have weak or no direct association with functional divergence of the three breeds.The B-DMRs in promoters of ATs showed that the Rongchang and Tibetan breed are closer to each other than the Landrace pig (Fig. 6a). The same analysis in muscle tissues showed that the Landrace breed is closer to the Tibetan than the Rongchang breed (Fig. 6b). The same distance relationship pattern of the three breeds is reflected by the corresponding mRNA expression data cluster-ing (Supplementary Fig. S5). The different clustering patterns may be explained by the marked phenotypic changes between the feral Tibetan, the leaner Landrace and the fatty Rongchang pig breeds because of opposite breeding direction, which results in differences not only at the genetic level, but also in the epigenetic state, and potential genotype–epigenotype interactions32 as well.In addition, the T-DMRs in promoters could largely cluster samples of the same tissue type together (Fig. 6c), indicating that promoter methylation also correlates with adipose distribution across the anatomic locations. It is well established that VATs have intrinsic features distinct from SATs, and are more highly correlated with the metabolic risk factors of obesity than SATs4,6–8. Interest-ingly, intermuscular adipose (IAD), which deposited between mus-cle bundles, was more similar to VATs in terms of methylation. This observation suggests that IAD may be a new risk factor for obesity-related diseases. Pericardial adipose (PAD) around coronary arter-ies is a higher correlative risk factor for cardiovascular disease than other VATs, and although thoracic PAD shares a common embryonic origin with other abdominal VATs—the splanchnic mesoderm33, we observed significant-site specific differences in methylation rate between them (Fig. 6c). Tissue types are also better discriminated by T-DMRs in promoters than in other genomic elements (Supple-mentary Fig. S5). X chromosome methylation between male and female is expected to be significant because of the overriding effect of X chromosome inactivation in females18. Clustering of S-DMRs by sex was less distinct after removing DMRs on the X chromosome (Supplementary Fig. S5).
Genes involved in phenotypic divergence. To study the association of differential methylation in promoter regions with phenotypic divergence, we first investigated the relationship between DNA methylation at promoters and the expression data of known obes-ity-related genes obtained through and MassArray and quantitative PCR (q-PCR). For example, FTO (fat mass- and obesity-associated gene) is a gene unequivocally associated with obesity and is ubiq-uitously expressed34,35. From the leaner Landrace, feral Tibetan to
????the fatty Rongchang breed, and across both adipose and muscle tis-sue types, FTO is hypermethylated in the D region of the promoter with a lower gene expression level (Fig. 7a). The fact that the level of methylation is highest in Landrace pig and lowest in Rongchang pig is consistent with the observation that loss of FTO expression and/or function protects against obesity and food intake35. ATP1B1, which encodes the ubiquitously expressed β subunit of Na + /K + ATPase, is required for the proper cellular positioning of ATPase and its stabil-ity. Decreased ATPase activity precedes obesity and hyperinsulinae-mia by influencing thermogenesis and energy balance36. COL8A2, which en codes the α2 chain of type VIII collagen, is necessary for mesangial matrix expansion, as well as for hypercellularity. Lack of COL8A2 confers renoprotection in diabetic nephropathy37. Both ATP1B1 and COL8A2 have hypermethylation in I region of pro-moter and lower gene expression level that is more pronounced in the VATs and IAD than SATs (Fig. 7b), suggesting that hypermeth-ylation in promoters of these two genes are potential biomarkers of high-risk visceral obesity.We also found correlation between methylation in promoter and gene expression, and reasonable association to breed and anatomic location divergence, for many other genes with known roles in adi-pose deposition and muscle growth. For example, ESD that increases expression in obesity-prone models38; PPP1R3C that functions against intramyocellular lipid build-up, and reduces circulating leptin and triglycerides39; GHSR that promotes growth hormone-release and increased lean, but not fat, mass in obese subjects40; LIPA that inhibits intramuscular lipid stores41; MC4R that inhibits food intake and prevents hyperinsulinaemia and hyperglycinaemia42; and PROX1 that prevents lymphatic vascular defects that cause adult-onset obesity43 (Supplementary Fig. S6). The genes preferen-tially expressed in adipose (such as HEXB and HTR2A) or muscle (such as ACE, PRKAR1A and PRKCQ) tissues only, were validated by the methylation in the promoter and gene expression data as well (Supplementary Fig. S6). The full list of candidate obesity-related genes we collected together with their DNA methylation pattern in promoters is provided in Supplementary Data 1 and 2.In addition, out of the 2,311 genes/~282.57 Mb quantitative trait loci (QTLs) region assembled from 901 high confidence and narrowed ( < 2 Mb) QTLs affecting fatness and pork quality in the PigQTL database44; 1,669 (72.22%) genes overlap with the defined DMRs (Supplementary Data 3–5). This high consistency highlights the potential of identifying candidate regions or genes of quantita-tive traits (such as obesity) based on genome-wide DNA methyla-tion data, such as the newly developed methylation QTL analysis15. Notably, out of 77 putative genes located in these QTLs region, 66 (85.71%) overlap with our defined DMRs. Methylation level of these gene’s promoters strongly inversely correlated with the gene expres-sion, suggesting that these uncharacterised protein coding genes may be involved in adipose deposition and muscle growth. Typical examples are shown in Supplementary Fig. S7.

nATuRE CommunICATIons | 3:850 | DoI: 10.1038/ncomms1854 | www.61k.comaturecommunications
? 2012 Macmillan Publishers Limited. All rights reserved.
nATuRE CommunICATIons | DoI: 10.1038/ncomms1854
ARTICLE
% of total genome-wide CpG numberGene body
2HCP, ICP, LCP D, I, P = 0.416Interacton = 0.918
18

Mean
Muscle S-DMRsT-DMRs
14
14120
2
134013
D, I, P = 0.053
40
8
7
3′350300Number of promoters
2502001501005000
0.2
HCPICPLCPLocation classesCGI shore versus CGIInteracton = 0.995
0.40.6CpGo/eratio
0.811.2
300Number of thegenomic eleme2502001501005000
mRNA promoter CGI shoremRNA promoter CGI
P < 10–16
6005004003002001000
0.2
0.4
0.6
0.8
1
1.2
Intragenic CGI shoreIntragenic CGI
P < 10–16
100806040200
0.2
0.4
0.6
0.8
1
1.2
3′ Transcript CGI shore3′ Transcript CGI
P < 10–16
6005004003002001000
0.2
0.4
0.6
0.8
1
1.2
Intergenic CGI shoreIntergenic CGI
P < 10–16
1086420
0.2
0.4
0.6
0.8
1
1.2
miRNA promoter CGI shoremiRNA promoter CGI
P < 10–16
0.20.40.60.811.2
CpGo/e ratio
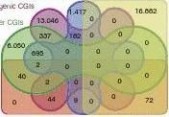
Figure 4 | Genome-wide distribution of differentially methylated regions. (a) Circular representation of the genome-wide distribution of DmRs. This visualisation was generated using the Circos software58. The outermost circle displays pig chromosomes with scale and the CpGo/e ratio at 1 mb bins. The second circle displays the 282 pig genes that are orthologs to the well-annotated human obesity-related genes (supplementary Data 1), of which 223 (79%) genes overlapping the defined DmRs are in blue colour and the remaining 59 genes (21%) in red (supplementary Data 2). The third to ninth circles represent seven categories of DmRs (A: muscle B-DmRs, B: Adipose T-DmRs, C: Adipose B-DmRs, D: Adipose versus muscle T-DmRs, E: muscle T-DmRs, F: Adipose s-DmRs and G: muscle s-DmRs). The height of the histogram bins indicates number of CpGs in the DmRs. The DmR-rich (deep colour, χ2-test, P < 0.001) and DmR-poor (light colour, χ2-test, P > 0.001) bins are defined by comparing with genome average. TEs: transcription end site. (b) All 17,930 promoters in the pig genome were classified into three types based on CpG representation. HCPs (blue, n = 7,249)【61阅读】, ICPs (yellow, n = 6,629) and LCPs (red, n = 4,052). (c) Venn diagram showing the distribution of all 38,778 CGIs in the pig genome among 5 CGI classes. Promoter CGIs (n = 7,126), intragenic CGIs (n = 13,611), 3′-transcript CGIs (n = 2,305), intergenic CGIs (n = 16,954) and miRnA promoter CGIs (n = 169) were defined according to their genomic locations. There are overlaps between five classes of CGIs, because of the overlapping gene annotation at a specific genome coordinate. (d) Percentage of CpGs within DmRs in each of the 31 genomic elements. The statistical significance of comparison among the three miRnA promoters (D, I, P) was calculated by one-way repeated-measures AnoVA, whereas others by two-way repeated-measures AnoVA. (e) Distribution of CpGo/e ratio for CGIs and their shores in five CGI classes. Wilcoxon rank-sum test was used to determine the difference of CpGo/e ratio between CGIs and their shores.
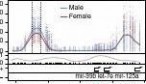
Furthermore, numerous miRNAs having known or potential roles in obesity were also identified (Supplementary Data 6). We found an S-DMR with hypermethylation in males compared with females. This S-DMR is located in the promoter region of an miRNA cluster that includes adjacent miR-99b, let-7e and miR-125a (Fig. 7c). Although no previous evidence exists for a direct relationship of these three miRNAs to obesity, the key functions and targets of these miRNAs are associated with the suppression of prostate cancer in male45 and breast cancer in female46, and therefore, potentially contribute to sexual differences in obesity development.
To identify novel genes potentially responsible for phenotypic differences, we performed enrichment analysis for genes with DMRs
??
nATuRE CommunICATIons | 3:850 | DoI: 10.1038/ncomms1854 | www.61k.comaturecommunications
? 2012 Macmillan Publishers Limited. All rights reserved.
ARTICLE
in promoters (Supplementary Fig. S8; Supplementary Data 7 and 8). As expected, most enriched functional Gene Ontology categories of adipose B-DMRs in promoters were related to the pathogenesis of obesity, such as ‘homeostasis of sterol, lipid, cholesterol’, ‘lipase inhibitor activity’, ‘type I diabetes mellitus’ and ‘dyslipidaemia’ (Fig. 7d). Notably, the multigene family of glutathione transferase and cytochrome P450, two important groups of multifunctional detoxifying enzymes responsible for metabolising an array of xeno-biotic compounds47,48, were among the enriched adipose B-DMRs in promoters (Fig. 7d). ‘Trans-1,2-dihydrobenzene-1,2-diol dehy-drogenase activity’ enzymes, which also participate in metabolism of endocrinally disruptive xenobiotics49, were universally identi-D (173)
nATuRE CommunICATIons | DoI: 10.1038/ncomms1854
P D, I, P = 0.07P HCP, ICP, LCP= 5.56 ×10⁻⁴
mRNA
I (159)
miRNA
P (208)
CGI shore (127)
CGI (81)
25
50
75
100
% of mRNA/miRNA – DMR pairs
Figure 5 | Percentage of mRNAs and miRNAs having expression level negatively correlated with promoter methylation level. only 3,074 probes uniquely representing 3,074 mRnA and 611 uniquely mapped miRnA genes with the high-confidence expression data from the same samples for meDIP-seq were used (see supplementary methods). The mRnA/miRnA–DmR pairs, which have downregulation together with promoter hypermethylation, or upregulation together with promoter hypomethylation, were taken as having negative correlation between
expression and methylation. The total number of identified mRnA/miRnA–DmR pairs were shown in the brackets. Grey bars represent the percentage of mRnA/miRnA–DmR pairs that exhibit the inverse relationship in total mRnA/miRnA–DmR pairs. The statistical significance was calculated by two-way non-repeated-measures AnoVA.
Adipose B-DMRs in promoters (1,994)
Muscle B-DMRs in promoters (4,816)
fied among enriched adipose T-DMRs in promoters (Supplemen-tary Data 8). Pigs as well as humans are exposed to an increasing numbers of environmental xenobiotics through ingestion of con-taminated food or water, inhalation of polluted air or even der-mal exposure. A link between exposure to endocrinally disruptive xenobiotics and obesity has been proposed50. Our finding suggests that DNA methylation rate changes of genes coding for detoxifying enzymes induced by pollutants may potentially explain the patho-genicity of obesity caused by chemical environmental endocrine disruptors.
Our analyses also revealed many other functional gene catego-ries that were potentially involved in adipose and muscle regulation (Supplementary Data 8). For example, immune-related gene catego-ries, including ‘RIG-I-like receptor signalling pathway’, ‘interferon-α/β receptor binding’, ‘natural killer cell-mediated cytotoxicity’ and ‘antigen processing and presentation’, were identified among the enriched muscle B-DMRs in promoters, which is consistent with previous finding of obesity-induced immune dysfunction51. Intriguingly, given that AT derives from mesoderm, the identifi-cation of ‘mesoderm development’ gene category among enriched adipose S-DMRs in promoters indicated that sex-specific obesity is potentially related to the establishment of differential methyla-tion during embryonic development. In addition, the enriched gene categories of muscle T-DMRs, and adipose versus muscle T-DMRs, in promoters reflected the well-characterised tissue-specific func-tions. Methylation differences in genes coding for proteins involved in GTP-related energy metabolism may be responsible for the dif-ferences in percentage of mitochondria between the two phenotypi-cally distinct SMTs17. Differential methylation of genes involved in ‘cytoskeletal protein binding’, ‘regulation of cellular protein meta-bolic process’ and ‘enzyme activator activity’ may explain the devel-opmental differences between adipose and muscle tissues52.
Discussion
This study reports the comprehensive genome-wide epigenetic survey of various adipose and SMTs, based on directly sequenced animal DNA methylomes. Through identification of DMRs among breeds, sexes and anatomic locations, and classification of the DMRs according to their locations in various genomic elements, we found that DMRs in promoters can repress gene expression and are highly associated with phenotypic variation. Identified DMRs were preferentially situated in ICP and in CGI shores. This validated the hypothesis that weak CGIs are more prone to regulation by DNA methylation, as the higher feasibility for weak CGIs to become
Adipose T-DMRs in promoters (4,673)


Thoracic VAT
PAD
M-D-PATFAD-PAD-PLF
TF-ULBRM-ULBLF-ULBLM-TMULBR-ULRF-UBM-ILLBB
LF-RADLF-ASALM-ALFSALM-ULBLM-UL-ILBB
-PTMMM
RF-LDM
Backfat SAT
RRMM-P-GADRMOMRM-IAD-MARM-IDLBRM-ULB
LFRM-IA-RFIADD-ITF-ADIAD
RF-IADRF-MADOMRF-GBULRF-AD-RBRFF-ILR
R-GADOMTF-MATM-D
MADTM-G
OMTM-IADTF-IADTF-ILB
ASATM-B
UL-TMULBB-IL
TFM-T
TF
TF

-
500
200
RF
200
AD-MADMLM-RBLF-ILADLF-ML-PADLFMLF-GOLF-IADLM-IADLM-GO
M
RFLM-PARM-ASADRM-R-AADSA
M
-P
TF
-LD
Abdominal VAT
-LDRM
M
TF-PMMRM-PMM
TM
-LD
M
LF
LM
-LDM
LMRM-PAM-PAD-GOD LM-GM
OMLF-GO
MTM-GOMRF-GOMTF-GOM
ADLF-RD
R-ATFRAD
-ADMT-ILM
MM
M
-PM
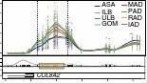
LF
Figure 6 | Hierarchical clustering of samples using DMRs in promoters. (a) Clustering of adipose samples using 1,994 adipose B-DmRs in promoters. (b) Clustering of muscle samples using 4,816 muscle B-DmRs in promoters. By definition, the three pig breeds are completely segregated. The three major subgroups in the radial dendrograms correspond perfectly to pig breed, regardless of sexes and tissue types. (c) Clustering of adipose samples using 4,673 adipose T-DmRs in promoters results in most of the eight variant adipose samples are discriminated from each other. The numbers in the brackets showed the amount of DmRs used in clustering.
????
nATuRE CommunICATIons | 3:850 | DoI: 10.1038/ncomms1854 | www.61k.comaturecommunications
D-PATMSA-ATFAD-PTFAD-RTM
RF
B-ILRF-ILBTF-ILBLFLBLM-ITM-ILBTM-ITM-ARF-AS
ALF-ALMSA-ATFSARM-ASA-ASA
IAD
Abdominal SAT
PF-R
ADRDF-R-RARM-RADLMDMALF-M-MADRTF-MADRF-MADLM-MTM-MADAD
AD
? 2012 Macmillan Publishers Limited. All rights reserved.
LM-PMM
-LDM
IAD
Abdominal VAT
nATuRE CommunICATIons | DoI: 10.1038/ncomms1854
ARTICLE
b
CpGmethylation
COL8A2 (Adipose T-DMR)
a
CpGmethylation
FTO (Muscle B-DMR)
CpGdensityGenes
CpGdensityGenes
ASAILBULBGOMMADPADRADIAD
MeDIP-seqCpG methylation
4030201000
0.2
0.4
0.6
Microarray
FTOMeDIP-seqCpG methylation
LTR
3020100
1,9~111115,1118,1


Methylationratio
Methylationratio
0.5
1
1.5
2
2.5
3
3.5
Microarray
ATP1B1Microarray
COL8A2q-PCR
ATP1B1 mRNA expression
Microarray
FTO


q-PCR
FTO mRNA expression
q-PCR
FTO mRNA expression
Expression(log)
Expression(lo)
q-PCR
COL8A2 mRNA expression
c
CpGmethylation
mir-99b, let-7e and mir-125a
(Adipose S-DMR)
d
–lo (Corrected EASE score)
GO-BP
ity
ivmticleitys systostbyea cytm psisNocrouchrScelessTyteroomos
pel he Pide-o 4Im triCe50phhodiabeosleostetasphstes ratmisaol e
Gse homllituTPresegoasue latstasireorsgu alactivtor aityctivityMagneERegnzsiuulymm –lo (Corrected EASE score)iatioe inon bin ndofhibi lipitor ingdaSt bioctiveChorolsynity htleomhessteoisLieroplRas hostaegse mulineoisathi
iobistan tofProo r asis steteinctivro idsecity breCiLoelipsytionl si
SHd hnthurfa2 omesiscedoeo resmcNai tas
egeptn biisoratnd-ive linkinNregegedgat uslaigGivenaNtio-p
roregeun ol tr–lo (Corrected EASE score)ulterof ganaintiologensd-cucicenou
pl of al s exptionlipedysr reid teescecam siotanpptboroc or liceR pssegMaprorognteulceinatssioesiu si
gn mnofa il synon blingapiticndinTeReg gRulmpeesplasattrapoionsicitytun reof he to gom plu
taeHmatostae sesiscretion
L versus RL versus TT versus R8230
32
1210
19
181512
64
86420
3015
3
16
55
30
3
633
2
5224
51
40
5834
6
4
5
9630
24
8
3
5
54
00
CpGdensityGenes
ace asersf
inism
Metabolan
se tr
pane
Li
N
to
hi o
Li
io
th
eu
ro
ta
Glu
Figure 7 | Examples of obesity-related genes and functional gene categories showing differential DNA methylation in promoters. (a) The adipose and muscle B-DmR in FTO promoter. Top panels, t op half: CpG methylation. Each point represents methylation level (meDIP-seq read depth) of a sample at a given CpG site. The curves showed average over the samples. The two vertical dashed lines marked the boundaries of the DmR identified. Lower half: CpG dinucleotides (black tick marks on X axis), CpG density (grey line), Tss (black arrow), exons and introns (filled black and white boxes, respectively). Plus and minus marks denote sense and antisense gene transcription. second panels: validation of individual CpG methylation by massArray (mapping to yellow box in upper panel). Third panels: a scatter plot and trend line (Pearson correlation) showing correlation between the log2 ratios of mRnA expression from microarray and CpG methylation of the DmR from meDIP-seq. Bottom panels: validation of mRnA expression levels by q-PCR. Bars represent the mean expression level. (b) The adipose T-DmR in ATP1B1 and COL8A2 promoters. (c) The adipose s-DmR in miRnAs mir-99b, let-7e and mir-125a promoters. (d) Top ten Go (Gene ontology) and pathway categories enriched for adipose B-DmRs in promoters. The enrichment analysis was performed using the DAVID software59 (see supplementary methods). The EAsE score, indicating significance of the comparison, was calculated using Benjamini-corrected modified Fisher’s exact test. BP: biological process, mF: molecular function.
de novo methylated regions, and preferentially associated with the general phenomenon and non-malignant, common complex dis-eases (such as obesity) instead of the highly heterogeneous lesions (such as cancer)22. We also found that the intermuscular IAD was more similar to the VATs in methylation pattern, which provided the first epigenomic evidence for IAD as a candidate risk factor for obesity. The data set and research here shed new light on the epig-enomic regulation of adipose deposition and muscle growth.
It is considered that pigs can serve as a good biomedical model for human obesity studies because they share the same general physiol-ogy with human. Indeed, we found that about 80% of the known or candidate human obesity-related genes and 72% of genes in the QTL
f x
en
ob
io
lo
gi
ca
pi
d
ho
bi
r a
tiv
ct
regions that affect fatness and pork quality were within our defined DMRs. Detailed analysis indicated that the methylation regulation patterns of these genes are consistent with their known biological functions. We also predicted many novel candidate genes that were associated with variation in obesity-related phenotypes and that require further experimental validation. Domesticated breeds also provide additional advantage of highly homogeneous genetic back-grounds, large litter size (10~12 piglets per litter; 24~36 piglets per year), short generation interval (12 months) and a homogeneous feeding regime, which are particularly suitable for survey of trans-generational epigenetic inheritance53. In addition to providing new

information for biomedical research, genomic/epigenomic studies
??
nATuRE CommunICATIons | 3:850 | DoI: 10.1038/ncomms1854 | www.61k.comaturecommunications
? 2012 Macmillan Publishers Limited. All rights reserved.
ARTICLE
of pigs may also help uncover the molecular basis that underlies economic traits in pig, which can be used to improve the efficiency of artificial selection, hence the production of healthier pork.nATuRE CommunICATIons | DoI: 10.1038/ncomms1854the 21,533 Ensembl genes, together with the 13,626 intergenic regions, 4,309,043 repeats and 59,385 SNPs by referring to the UCSC Genome Browser for pig.
MassArray. The DNA isolated from three biological replicates for each breed/sex/tissue type combination were pooled in equal quantities and treated with bisulphite using an EZ DNA methylation-Gold Kit (ZYMO Research) according to the manufacturer’s specifications. Quantitative methylation analysis of the DMRs was performed using the Sequenom MassARRAY platform (CapitalBio, Beijing, China) as described previously56. PCR primers were designed using the EpiDesigner software (Sequenom). The oligo sequences and the genomic coordinates of the amplicons across which DNA methylation was assessed in this study are given in Supplementary Table S2. The resultant methylation calls were analysed with EpiTy-per software v1.0 (Sequenom) to generate quantitative results for each CpG or an aggregate of multiple CpGs.
Gene expression microarray. Genome-wide gene expression analysis of 180 samples that corresponded to the samples used for MeDIP-seq was performed using the Agilent Pig Gene Expression Oligo Microarray (Version 2). Data analysis was performed with MultiExperiment Viewer. Details are listed in Supplementary Methods.
Quantitative PCR. RNase-free DNase I (TaKaRa) was used for removal of genomic DNA from RNA samples used for microarray analysis. cDNA was synthesised using the oligo (dT) and random 6-mer primers provided in the PrimeScript RT Master Mix kit (TaKaRa). q-PCR was performed using the SYBR Premix Ex Taq kit (TaKaRa) on a CFX96 Real-Time PCR detection system (Bio-Rad). Primer sequences used for the q-PCR are shown in Supplementary Table S3. All measure-ments contained a negative control (no cDNA template), and each RNA sample was analysed in triplicate. Porcine ACTB, TBP and TOP2B were simultaneously used as endogenous control genes. Relative expression levels of objective mRNAs were calculated using the ??Ct method.
miRNA discovery and profiling. Eight ATs and two SMTs of the three female Landrace pigs were used for small RNA-seq. The construction of small RNA librar-ies and single-end sequencing in 36 bp reads using Illumina Genome Analyzer II, generated a total of 7.12 Gb reads for the ten libraries. The bioinformatics pipeline for miRNA discovery was carried out as our previous description57, with some improvements. Details are listed in Supplementary Methods. Our results extend the repertoire of pig miRNAome to 803 pre-miRNAs (174 known, 210 novel and 419 candidate), encoding for 1,014 mature miRNAs, of which 952 are unique (Supplementary Data 9).
1. Kelly, T., Yang, W., Chen, C. S., Reynolds, K. & He, J. Global burden of obesity in 2005 and projections to 2030. Int. J. Obes. (Lond) 32, 1431–1437 (2008).2. MacDougald, O. A. & Burant, C. F. The rapidly expanding family of adipokines. Cell Metab. 6, 159–161 (2007).3. Rosen, E. D. & Spiegelman, B. M. Adipocytes as regulators of energy balance and glucose homeostasis. Nature 444, 847–853 (2006).4. Despres, J. P. & Lemieux, I. Abdominal obesity and metabolic syndrome. Nature 444, 881–887 (2006).5. Lusis, A. J., Attie, A. D. & Reue, K. Metabolic syndrome: from epidemiology to systems biology. Nat. Rev. Genet. 9, 819–830 (2008).6. Ibrahim, M. M. Subcutaneous and visceral adipose tissue: structural and functional differences. Obes. Rev. 11, 11–18 (2010).7. Tran, T. T., Yamamoto, Y., Gesta, S. & Kahn, C. R. Beneficial effects of subcutaneous fat transplantation on metabolism. Cell Metab. 7, 410–420 (2008).8. Satoor, S. N. et al. Location, location, location: beneficial effects of autologous fat transplantation. Sci. Rep. 1, 81 (2011).9. Spurlock, M.E. & Gabler, N. K. The development of porcine models of obesity and the metabolic syndrome. J. Nutr. 138, 397–402 (2008).10. Rocha, D. & Plastow, G. Commercial pigs: an untapped resource for human obesity research? Drug Discov. Today 11, 475–477 (2006).11. Andersson, L. How selective sweeps in domestic animals provide new insight into biological mechanisms. J. Intern. Med. 271, 1–14 (2012).12. Heid, I. M. et al. Meta-analysis identifies 13 new loci associated with waist-hip ratio and reveals sexual dimorphism in the genetic basis of fat distribution. Nat. Genet. 42, 949–960 (2010).13. Speliotes, E. K. et al. Association analyses of 249,796 individuals reveal 18 new loci associated with body mass index. Nat. Genet. 42, 937–948 (2010).14. Feinberg, A. P. Epigenomics reveals a functional genome anatomy and a new approach to common disease. Nat. Biotechnol. 28, 1049–1052 (2010).15. Rakyan, V. K., Down, T. A., Balding, D. J. & Beck, S. Epigenome-wide association studies for common human diseases. Nat. Rev. Genet. 12, 529–541 (2011).16. Feinberg, A. P. et al. Personalized epigenomic signatures that are stable over time and covary with body mass index. Sci. Transl. Med. 2, 49ra67 (2010).MethodsAnimals. Nine females and nine males at 210-day-old for each of the Landrace (a leaner, Western breed), the Tibetan (a feral, indigenous Chinese pig that has not undergone artificial selection) and the Rongchang (a fatty, Chinese breed) pig breeds were used in this study. There is no direct and collateral blood relation-ship within the last 3 generations among the 18 pigs from each of the breeds. The piglets were weaned simultaneously at 28 ± 1 day of age. A starter diet provided 3.40 Mcal kg ? 1 metabolisable energy (ME), 20.00% crude protein and 1.15% lysine from the thirtieth to sixtieth day after weaning. From the sixty-first to one hundred and twentieth day, the diet contained 3.40 Mcal kg ? 1 ME, 17.90% crude protein and 0.83% lysine. From the one hundred and twenty-first to two hundred and tenth day, the diet contained 3.40 Mcal kg ? 1 ME, 15.00% crude protein and 1.15% lysine. The animals were allowed access to feed and water ad libitum and lived under the same normal conditions.Tissue collection. Animals were humanely killed as necessary to ameliorate suffer-ing and not fed the night before they were slaughtered. All the animals and samples used in this study were collected according to the guidelines for the care and use of experimental animals established by the Ministry of Agriculture of China.Eight ATs from different body sites and two phenotypically distinct SMTs were rapidly separated from each carcass, immediately frozen in liquid nitrogen and stored at ? 80 °C until RNA and DNA extraction. The eight ATs are divided into four groups: (1) three types of SATs (that is, abdominal subcutaneous adipose, upper layer of backfat and inner layer of backfat near the last third or fourth rib); (2) three types of VATs in the abdominal cavity (i.e., greater omentum, mesenteric adipose and retroperitoneal adipose); (3) one type of VAT in the thoracic cavity (i.e., PAD, which is located between visceral and parietal pericardium); and (4) IAD, the adipose visible between muscle groups and beneath the muscle fascia in the hips. Two phenotypically distinct SMTs are LDM (typical white SMT) near the last third or fourth rib and the intermediate section of PMM (typical red SMT).Measurements of obesity-related phenotype. Measurements of pig body den-sity, concentrations of 24 serum-circulating indicators of metabolism, adipocyte volume, myofibre cross-sectional area, myofibre type rate (fast/slow) and fatty acid composition are described in detail in Supplementary Methods.Methylated DNA immunoprecipitation sequencing. We randomly selected three pigs with a specific sex from each breed as biological replicates. And we have ten tis-sues for each individual; so in total, 180 samples were sequenced separately. MeDIP DNA libraries were prepared following the protocol as our previous description54. Each MeDIP library was subjected to paired-end sequencing using Illumina HiSeq 2000 and a 50 bp read length. Details are listed in Supplementary Methods.Identification of DMRs. After filtering the low-quality reads, the MeDIP-seq data were aligned to the UCSC pig reference genome (Sscrofa9.2) using SOAP2 (Version 2.21)55. The genomic regions enriched in methylated CpGs B-DMRs, S-DMRs and T-DMRs were identified using our newly developed method by calculating variation of single CpG. Additional details for the process are listed in Supplementary Methods.Definition of genomic elements. We referred to the UCSC pig reference genome (Sscrofa9.2) annotation data for the identification of genomic elements. All 17,930 promoters ( ? 2,200 to + 500 bp) were classified into three types according to CpG representation as previously described22. There were 7,249 HCPs, 6,629 ICPs and 4,052 LCPs (Fig. 4b). Each promoter of 2,700 bp length was divided into three regions as previously described28: P ( ? 200 to + 500 bp), I ( ? 200 to ? 1,000 bp) and D ( ? 1,000 to ? 2,200 bp). We obtained genomic locations of 38,778 CGIs and definitions of 21,533 Ensembl genes from the UCSC pig reference genome (Sscrofa9.2), as well as genomic locations of 803 pre-miRNAs based on our small RNA-seq results. We grouped CGIs into five classes on the basis of their distance to Ensembl genes or pre-miRNAs as previously described23 with some modifications (Fig. 4c). There are (1) 7,126 promoter CGIs (if a CGI ends after 1,000 bp upstream of a gene’s TSS, and starts before 300 bp downstream of a gene’s TSS); (2) 13,611 intragenic CGIs (if a CGI starts after 300 bp downstream of a gene’s TSS and ends before 300 bp upstream of a gene’s transcription end site (TES)); (3) 2,305 3′-tran-script CGIs (if a CGI ends after 300 bp upstream of a gene’s TES and starts before 300 bp downstream of a gene’s TES); (4) 16,954 intergenic CGIs (if a CGI starts after 300 bp downstream of a gene’s TES and ends before 1,000 bp upstream of a gene’s TSS); (5) 169 miRNA promoter CGIs (if there was a > 60% overlap of a CGI with 2 kb upstream of the pre-miRNA). There are overlaps between five classes of CGIs, because of the overlapping gene annotation at a specific genome coordinate. CGI shores were defined as extending up to 2 kb from CGIs.We also identified the genomic locations of the 17,932 first exons, 14,760 first introns, 117,200 internal exons, 116,186 internal introns and 15,259 last exons of
??0??ReferencesnATuRE CommunICATIons | 3:850 | DoI: 10.1038/ncomms1854 | www.61k.comaturecommunications
? 2012 Macmillan Publishers Limited. All rights reserved.
nATuRE CommunICATIons | DoI: 10.1038/ncomms1854
17. Lefaucheur, L., Ecolan, P., Plantard, L. & Gueguen, N. New insights into muscle fiber types in the pig. J. Histochem. Cytochem. 50, 719–730 (2002).18. Hellman, A. & Chess, A. Gene body-specific methylation on the active X chromosome. Science 315, 1141–1143 (2007).19. Weber, M. et al. Chromosome-wide and promoter-specific analyses identify sites of differential DNA methylation in normal and transformed human cells. Nat. Genet. 37, 853–862 (2005).20. Kerkel, K. et al. Genomic surveys by methylation-sensitive SNP analysis identify sequence-dependent allele-specific DNA methylation. Nat. Genet. 40, 904–908 (2008).21. Rankinen, T. et al. The human obesity gene map: the 2005 update. Obesity (Silver Spring) 14, 529–644 (2006).22. Weber, M. et al. Distribution, silencing potential and evolutionary impact of promoter DNA methylation in the human genome. Nat. Genet. 39, 457–466 (2007).23. Maunakea, A. K. et al. Conserved role of intragenic DNA methylation in regulating alternative promoters. Nature 466, 253–257 (2010).24. Takai, D. & Jones, P. A. Comprehensive analysis of CpG islands in human chromosomes 21 and 22. Proc. Natl Acad. Sci. USA 99, 3740–3745 (2002).25. Doi, A. et al. Differential methylation of tissue- and cancer-specific CpG island shores distinguishes human induced pluripotent stem cells, embryonic stem cells and fibroblasts. Nat. Genet. 41, 1350–1353 (2009).26. Irizarry, R. A. et al. The huan colon cancer methylome shows similar hypo- and hypermethylation at conserved tissue-specific CpG island shores. Nat. Genet. 41, 178–186 (2009).27. Ji, H. et al. Comprehensive methylome map of lineage commitment from haematopoietic progenitors. Nature 467, 338–342 (2010).28. Koga, Y. et al. Genome-wide screen of promoter methylation identifies novel markers in melanoma. Genome Res. 19, 1462–1470 (2009).29. Carthew, R. W. & Sontheimer, E. J. Origins and mechanisms of miRNAs and siRNAs. Cell 136, 642–655 (2009).30. Zhou, X., Ruan, J., Wang, G. & Zhang, W. Characterization and identification of microRNA core promoters in four model species. PLoS Comput. Biol. 3, e37 (2007).31. Vrba, L., Garbe, J. C., Stampfer, M. R. & Futscher, B. W. Epigenetic regulation of normal human mammary cell type specific miRNAs. Genome Res. 21, 2026–2037 (2011).32. Gertz, J. et al. Analysis of DNA methylation in a three-generation family reveals widespread genetic influence on epigenetic regulation. PLoS Genet. 7, e1002228 (2011).33. Ho, E. & Shimada, Y. Formation of the epicardium studied with the scanning electron microscope. Dev. Biol. 66, 579–585 (1978).34. Cecil, J. E., Tavendale, R., Watt, P., Hetherington, M. M. & Palmer, C. N. An obesity-associated FTO gene variant and increased energy intake in children. N. Engl. J. Med. 359, 2558–2566 (2008).35. Church, C. et al. Overexpression of Fto leads to increased food intake and results in obesity. Nat. Genet. 42, 1086–1092 (2010).36. Iannello, S., Milazzo, P. & Belfiore, F. Animal and human tissue Na,K-ATPase in obesity and diabetes: a new proposed enzyme regulation. Am. J. Med. Sci. 333, 1–9 (2007).37. Biswas, S. et al. Missense mutations in COL8A2, the gene encoding the alpha2 chain of type VIII collagen, cause two forms of corneal endothelial dystrophy. Hum. Mol. Genet. 10, 2415–2423 (2001).38. Wang, X. et al. Differential expression of liver proteins between obesity-prone and obesity-resistant rats in response to a high-fat diet. Br. J. Nutr. 106, 612–626 (2011).39. Crosson, S. M., Khan, A., Printen, J., Pessin, J. E. & Saltiel, A. R. PTG gene deletion causes impaired glycogen synthesis and developmental insulin resistance. J. Clin. Invest. 111, 1423–1432 (2003).40. Sun, Y., Wang, P., Zheng, H. & Smith, R. G. Ghrelin stimulation of growth hormone release and appetite is mediated through the growth hormone secretagogue receptor. Proc. Natl Acad. Sci. USA 101, 4679–4684 (2004).41. Du, H., Dardzinski, B. J., O’Brien, K. J. & Donnelly, L. F. MRI of fat distribution in a mouse model of lysosomal acid lipase deficiency. Am. J. Roentgenol. 184, 658–662 (2005).42. Farooqi, I. S. et al. Clinical spectrum of obesity and mutations in the melanocortin 4 receptor gene. N. Engl. J. Med. 348, 1085–1095 (2003).43. Harvey, N. L. et al. Lymphatic vascular defects promoted by Prox1 haploinsufficiency cause adult-onset obesity. Nat. Genet. 37, 1072–1081 (2005).44. Hu, Z. L., Fritz, E. R. & Reecy, J. M. AnimalQTLdb: a livestock QTL database tool set for positional QTL information mining and beyond. Nucleic. Acids Res. 35, D604–D609 (2007).45. Sun, D. et al. miR-99 family of MicroRNAs suppresses the expression of prostate-specific antigen and prostate cancer cell proliferation. Cancer Res. 71, 1313–1324 (2011).ARTICLE 46. Fu, S. W., Chen, L. & Man, Y. G. miRNA biomarkers in breast cancer detection and management. J. Cancer. 2, 116–122 (2011).47. Fabrini, R. et al. The extended catalysis of glutathione transferase. FEBS Lett. 585, 341–345 (2011).48. Yang, X. et al. Systematic genetic and genomic analysis of cytochrome P450 enzyme activities in human liver. Genome Res. 20, 1020–1036 (2010).49. Chow, K. C., Lu, M. P. & Wu, M. T. Expression of dihydrodiol dehydrogenase plays important roles in apoptosis- and drug-resistance of A431 squamous cell carcinoma. J. Dermatol. Sci. 41, 205–212 (2006).50. Tang-Peronard, J. L., Andersen, H. R., Jensen, T. K. & Heitmann, B. L. Endocrine-disrupting chemicals and obesity development in humans: a review. Obes. Rev. 12, 622–636 (2011).51. Iyer, A., Fairlie, D. P., Prins, J. B., Hammock, B. D. & Brown, L. Inflammatory lipid mediators in adipocyte function and obesity. Nat. Rev. Endocrinol. 6, 71–82 (2010).52. Harrison, B. C. & Leinwand, L. A. Fighting fat with muscle: bulking up to slim down. Cell Metab. 7, 97–98 (2008).53. Braunschweig, M., Jagannathan, V., Gutzwiller, A. & Bee, G. Investigations on transgenerational epigenetic response down the male line in F2 pigs. PLoS One 7, e30583 (2012).54. Li, N. et al. Whole genome DNA methylation analysis based on high throughput sequencing technology. Methods 52, 203–212 (2010).55. Li, R. et al. SOAP2: an improved ultrafast tool for short read alignment. Bioinformatics 25, 1966–1967 (2009).56. Ehrich, M. et al. Quantitative high-throughput analysis of DNA methylation patterns by base-specific cleavage and mass spectrometry. Proc. Natl Acad. Sci. USA 102, 15785–15790 (2005).57. Li, M. et al. MicroRNAome of porcine pre- and postnatal development. PLoS One 5, e11541 (2010).58. Krzywinski, M. et al. Circos: an information aesthetic for comparative genomics. Genome Res. 19, 1639–1645 (2009).59. Huang da, W., Sherman, B. T. & Lempicki, R. A. Systematic and integrative analysis of large gene lists using DAVID bioinformatics resources. Nat. Protoc. 4, 44–57 (2009).AcknowledgementsWe thank Cheng Ye for help with data management, and Carol Yueng and Chris Heble for help with manuscript editing. This work was supported by grants from the National Special Foundation for Transgenic Species of China (2009ZX08009-155B and 2011ZX08006-003), the Specialized Research Fund of Ministry of Agriculture of China (NYCYTX-009), the Project of Provincial Twelfth 5 Years’ Animal Breeding of Sichuan Province (2011YZGG15) and the International Science & Technology Cooperation Program of China (2011DFB30340) to X.L., and the National Natural Science Foundation of China (30901024) to M.L.Author contributionsM.L., H.W., Z.L., Y.X. and J.G. led the experiments and designed the analytical strategy. L.C., Jing W., L.Z., Y.J. and S.S. performed animal work and prepared biological samples. T.W., L.J., Y.W., J.Q., H.W., A.J., M.M, Y.G. and K.Z carried out the physiological, biochemical and histological studies, statistical analysis and prepared nucleic acids. Juan. W., L.W., N.L and Z.J performed the MeDIP-seq experiments. H.X., J.M., S.Z., Y.K.L., Z.Z and J.N performed gene expression microarray and data analysis. Q.L., H.C., X.G and Z.M performed small RNA-seq and data analysis. S.H., N.Y., Z.W., D.X. and G.Y. developed the bioinformatics scripts for MeDIP-seq data analysis. S.B., G.S.P., N.L., K.L., H.Y., Y.R.L., Jian. W., X.Z. and Jun. W. helped design and contributed to the data interpretation. X.L. and R.L. designed the study, supervised the experiments and wrote the paper with the assistance of M.L. and H.W.Additional informationAcccession codes: The high-throughput sequencing data and microarray data have been deposited in NCBI’s Gene Expression Omnibus under GEO Series accession numbers GSE30344 (MeDIP-seq data), GSE30343 (gene expression microarray data) and GSE30334 (small RNA-seq data).Supplementary Information accompanies this paper at http://www.61k.comaturecommunicationsCompeting financial interests: The authors declare no competing financial interests.Reprints and permission information is available online at http://npg.nature.com/reprintsandpermissions/How to cite this article: Li, M. et al. An atlas of DNA methylomes in porcine adipose and muscle tissues. Nat. Commun. 3:850 doi : 10.1038/ncomms1854 (2012).nATuRE CommunICATIons | 3:850 | DoI: 10.1038/ncomms1854 | www.61k.comaturecommunications????
? 2012 Macmillan Publishers Limited. All rights reserved.
二 : 四川农业大学老板山
又是1个周末,还是向原来一样,到老板山去找灵感。
老板山位于四川农业大学新校区的背后,也是四川农业大学的一部分,是同学们聚会、聊天、散步、锻炼身体、谈情说爱的地方。这里在一年四季都是那么的热闹,但对于我这样1个很忙的人来说,要是能够每天在山上静坐一会儿,那也是上天给我最好的眷顾了。但事实确是:我只能每周去一次,但这仅有的一次是我一星期都不会忘记的一件事情。对我来说,老板上有着巨大的魅力。
每次到老板上的感觉都是不一样的,因为是每周的星期天才会上去一次,所以这对于1个大学生来说,这样可以把一星期的困倦和不愉快抛在大自然;可以净化自己浮躁的心里;能够很冷静的分析一些遇到的问题;还可以对下一星期的学习和生活做1个很好的计划。对我来说,这几方面的事情是我在老板山上必须要做的事情。可以这么说,每次在上山前的心情即使是很坏,但只要你用心到老板山去溜达一圈,那么等你下来的时候你的心里是是充满着热情,心情是很愉快的。
这一星期到老板山上,我的心情是很沉重的。因为这几天我一直在考虑一些问题。主要有:关于自己在核心期刊上发表关于农村电子商务的文章的事情,对于自己毕业后再创业的事情等等。我在老板山上都考虑的很清楚了。在没有去的这一星期里,我的心情可以说是很乱的,有时是一整天在寝室上网,上得是头昏眼花的,本知道自己的做法是不对的,但总也是在电脑旁边坚持,其实也不知道自己在做些什么事情。很多时候都是要忙到寝室关灯的时候,弄得自己忙得天花地转,但结果却一无是处。其实,我敢说现在的很多大三的同学和我遇到的情况是一样的:课程很少,在外面也没有什么兼职工作,在学校也没有当什么重要的干部,也没有考虑考研等等。他们一天除了上网和上课外就基本上没有什么事情了,所以除了上课外上网就基本上是他们的主要工作了。我们知道,在电脑旁呆久了就会产生很多的负面影响。有可能影响我们的大脑,使我们的大脑系统受到电磁波的辐射变得反映慢,反映迟钝。这些我想很多同学都有深有体会吧。你是不是感觉自己的反映速度比以前慢了很多呢?是不是觉得头脑很昏,总打不起精神呢?对,这就要我们自己好好审视一下自己做的事情。给我的经验是,每当你上网上久了后,你如果到有很多绿叶的的地方去呆一会,你的感觉一下会很清晰很愉快。所以,每当我心情不好,遇到很重要的事情时,我都会去山上调节自己的心情。
我很感谢学校的老板山,是她给我的心里注入了新鲜的血液,使我在学校里的生活和学习有目标、有动力。让我的大学生活不那么的单点,不那么的糊涂。
亲爱的老板山,我爱你!!!
三 : 四川农业大学 林学概论课件

林学概论 四川农业大学 林学概论课件

林学概论 四川农业大学 林学概论课件

林学概论 四川农业大学 林学概论课件

林学概论 四川农业大学 林学概论课件

林学概论 四川农业大学 林学概论课件

林学概论 四川农业大学 林学概论课件

林学概论 四川农业大学 林学概论课件

林学概论 四川农业大学 林学概论课件

林学概论 四川农业大学 林学概论课件

林学概论 四川农业大学 林学概论课件

林学概论 四川农业大学 林学概论课件

林学概论 四川农业大学 林学概论课件

林学概论 四川农业大学 林学概论课件

林学概论 四川农业大学 林学概论课件

林学概论 四川农业大学 林学概论课件

林学概论 四川农业大学 林学概论课件

林学概论 四川农业大学 林学概论课件

林学概论 四川农业大学 林学概论课件

林学概论 四川农业大学 林学概论课件

林学概论 四川农业大学 林学概论课件

林学概论 四川农业大学 林学概论课件

林学概论 四川农业大学 林学概论课件

林学概论 四川农业大学 林学概论课件

林学概论 四川农业大学 林学概论课件

林学概论 四川农业大学 林学概论课件

林学概论 四川农业大学 林学概论课件

林学概论 四川农业大学 林学概论课件

林学概论 四川农业大学 林学概论课件

林学概论 四川农业大学 林学概论课件

61阅读提醒您本文地址:
林学概论 四川农业大学 林学概论课件
林学概论 四川农业大学 林学概论课件

林学概论 四川农业大学 林学概论课件

林学概论 四川农业大学 林学概论课件

林学概论 四川农业大学 林学概论课件

林学概论 四川农业大学 林学概论课件

林学概论 四川农业大学 林学概论课件

林学概论 四川农业大学 林学概论课件

林学概论 四川农业大学 林学概论课件

林学概论 四川农业大学 林学概论课件

林学概论 四川农业大学 林学概论课件

林学概论 四川农业大学 林学概论课件

林学概论 四川农业大学 林学概论课件

林学概论 四川农业大学 林学概论课件

林学概论 四川农业大学 林学概论课件

林学概论 四川农业大学 林学概论课件

林学概论 四川农业大学 林学概论课件

林学概论 四川农业大学 林学概论课件

林学概论 四川农业大学 林学概论课件

林学概论 四川农业大学 林学概论课件

林学概论 四川农业大学 林学概论课件

林学概论 四川农业大学 林学概论课件

林学概论 四川农业大学 林学概论课件

林学概论 四川农业大学 林学概论课件

林学概论 四川农业大学 林学概论课件

林学概论 四川农业大学 林学概论课件

林学概论 四川农业大学 林学概论课件

林学概论 四川农业大学 林学概论课件

林学概论 四川农业大学 林学概论课件

林学概论 四川农业大学 林学概论课件 61阅读提醒您本文地址:

林学概论 四川农业大学 林学概论课件

林学概论 四川农业大学 林学概论课件

林学概论 四川农业大学 林学概论课件
林学概论 四川农业大学 林学概论课件
林学概论 四川农业大学 林学概论课件
林学概论 四川农业大学 林学概论课件
林学概论 四川农业大学 林学概论课件
林学概论 四川农业大学 林学概论课件
林学概论 四川农业大学 林学概论课件
林学概论 四川农业大学 林学概论课件

林学概论 四川农业大学 林学概论课件

林学概论 四川农业大学 林学概论课件

林学概论 四川农业大学 林学概论课件

林学概论 四川农业大学 林学概论课件

林学概论 四川农业大学 林学概论课件

林学概论 四川农业大学 林学概论课件

林学概论 四川农业大学 林学概论课件

林学概论 四川农业大学 林学概论课件

林学概论 四川农业大学 林学概论课件

林学概论 四川农业大学 林学概论课件

林学概论 四川农业大学 林学概论课件

林学概论 四川农业大学 林学概论课件

林学概论 四川农业大学 林学概论课件

林学概论 四川农业大学 林学概论课件

林学概论 四川农业大学 林学概论课件

林学概论 四川农业大学 林学概论课件

林学概论 四川农业大学 林学概论课件

林学概论 四川农业大学 林学概论课件

林学概论 四川农业大学 林学概论课件

61阅读提醒您本文地址:
林学概论 四川农业大学 林学概论课件

林学概论 四川农业大学 林学概论课件

林学概论 四川农业大学 林学概论课件

林学概论 四川农业大学 林学概论课件

林学概论 四川农业大学 林学概论课件

林学概论 四川农业大学 林学概论课件

林学概论 四川农业大学 林学概论课件

林学概论 四川农业大学 林学概论课件

林学概论 四川农业大学 林学概论课件

林学概论 四川农业大学 林学概论课件

林学概论 四川农业大学 林学概论课件

林学概论 四川农业大学 林学概论课件

林学概论 四川农业大学 林学概论课件

林学概论 四川农业大学 林学概论课件

林学概论 四川农业大学 林学概论课件

林学概论 四川农业大学 林学概论课件

林学概论 四川农业大学 林学概论课件

林学概论 四川农业大学 林学概论课件

林学概论 四川农业大学 林学概论课件

林学概论 四川农业大学 林学概论课件

林学概论 四川农业大学 林学概论课件

林学概论 四川农业大学 林学概论课件

林学概论 四川农业大学 林学概论课件

林学概论 四川农业大学 林学概论课件

林学概论 四川农业大学 林学概论课件

林学概论 四川农业大学 林学概论课件

林学概论 四川农业大学 林学概论课件

林学概论 四川农业大学 林学概论课件

林学概论 四川农业大学 林学概论课件

林学概论 四川农业大学 林学概论课件 61阅读提醒您本文地址:

林学概论 四川农业大学 林学概论课件

林学概论 四川农业大学 林学概论课件
林学概论 四川农业大学 林学概论课件

林学概论 四川农业大学 林学概论课件

林学概论 四川农业大学 林学概论课件

林学概论 四川农业大学 林学概论课件

林学概论 四川农业大学 林学概论课件

林学概论 四川农业大学 林学概论课件

林学概论 四川农业大学 林学概论课件

林学概论 四川农业大学 林学概论课件

林学概论 四川农业大学 林学概论课件

林学概论 四川农业大学 林学概论课件

林学概论 四川农业大学 林学概论课件

林学概论 四川农业大学 林学概论课件

林学概论 四川农业大学 林学概论课件

林学概论 四川农业大学 林学概论课件

林学概论 四川农业大学 林学概论课件

林学概论 四川农业大学 林学概论课件

林学概论 四川农业大学 林学概论课件

林学概论 四川农业大学 林学概论课件

林学概论 四川农业大学 林学概论课件

林学概论 四川农业大学 林学概论课件

林学概论 四川农业大学 林学概论课件

林学概论 四川农业大学 林学概论课件

林学概论 四川农业大学 林学概论课件

林学概论 四川农业大学 林学概论课件

林学概论 四川农业大学 林学概论课件

林学概论 四川农业大学 林学概论课件

林学概论 四川农业大学 林学概论课件

61阅读提醒您本文地址:
林学概论 四川农业大学 林学概论课件

林学概论 四川农业大学 林学概论课件

林学概论 四川农业大学 林学概论课件

林学概论 四川农业大学 林学概论课件

林学概论 四川农业大学 林学概论课件

林学概论 四川农业大学 林学概论课件

林学概论 四川农业大学 林学概论课件
林学概论 四川农业大学 林学概论课件
林学概论 四川农业大学 林学概论课件

林学概论 四川农业大学 林学概论课件

林学概论 四川农业大学 林学概论课件
林学概论 四川农业大学 林学概论课件

林学概论 四川农业大学 林学概论课件

林学概论 四川农业大学 林学概论课件

林学概论 四川农业大学 林学概论课件

林学概论 四川农业大学 林学概论课件

林学概论 四川农业大学 林学概论课件

林学概论 四川农业大学 林学概论课件

林学概论 四川农业大学 林学概论课件

林学概论 四川农业大学 林学概论课件

林学概论 四川农业大学 林学概论课件

林学概论 四川农业大学 林学概论课件

林学概论 四川农业大学 林学概论课件
林学概论 四川农业大学 林学概论课件

林学概论 四川农业大学 林学概论课件

林学概论 四川农业大学 林学概论课件

林学概论 四川农业大学 林学概论课件

林学概论 四川农业大学 林学概论课件

林学概论 四川农业大学 林学概论课件

林学概论 四川农业大学 林学概论课件 61阅读提醒您本文地址:

林学概论 四川农业大学 林学概论课件

林学概论 四川农业大学 林学概论课件

林学概论 四川农业大学 林学概论课件

林学概论 四川农业大学 林学概论课件

林学概论 四川农业大学 林学概论课件

林学概论 四川农业大学 林学概论课件
林学概论 四川农业大学 林学概论课件

林学概论 四川农业大学 林学概论课件

林学概论 四川农业大学 林学概论课件

林学概论 四川农业大学 林学概论课件

林学概论 四川农业大学 林学概论课件
林学概论 四川农业大学 林学概论课件

林学概论 四川农业大学 林学概论课件

林学概论 四川农业大学 林学概论课件

林学概论 四川农业大学 林学概论课件

林学概论 四川农业大学 林学概论课件
林学概论 四川农业大学 林学概论课件
林学概论 四川农业大学 林学概论课件

林学概论 四川农业大学 林学概论课件

林学概论 四川农业大学 林学概论课件

林学概论 四川农业大学 林学概论课件

林学概论 四川农业大学 林学概论课件

林学概论 四川农业大学 林学概论课件

林学概论 四川农业大学 林学概论课件

林学概论 四川农业大学 林学概论课件

林学概论 四川农业大学 林学概论课件

林学概论 四川农业大学 林学概论课件

林学概论 四川农业大学 林学概论课件

林学概论 四川农业大学 林学概论课件

61阅读提醒您本文地址:
林学概论 四川农业大学 林学概论课件

林学概论 四川农业大学 林学概论课件

林学概论 四川农业大学 林学概论课件

林学概论 四川农业大学 林学概论课件
林学概论 四川农业大学 林学概论课件

林学概论 四川农业大学 林学概论课件

林学概论 四川农业大学 林学概论课件

林学概论 四川农业大学 林学概论课件

林学概论 四川农业大学 林学概论课件

林学概论 四川农业大学 林学概论课件

林学概论 四川农业大学 林学概论课件

林学概论 四川农业大学 林学概论课件

林学概论 四川农业大学 林学概论课件

林学概论 四川农业大学 林学概论课件

林学概论 四川农业大学 林学概论课件

林学概论 四川农业大学 林学概论课件

林学概论 四川农业大学 林学概论课件

林学概论 四川农业大学 林学概论课件

林学概论 四川农业大学 林学概论课件

林学概论 四川农业大学 林学概论课件

林学概论 四川农业大学 林学概论课件

林学概论 四川农业大学 林学概论课件

林学概论 四川农业大学 林学概论课件

林学概论 四川农业大学 林学概论课件
林学概论 四川农业大学 林学概论课件

林学概论 四川农业大学 林学概论课件

林学概论 四川农业大学 林学概论课件

林学概论 四川农业大学 林学概论课件

林学概论 四川农业大学 林学概论课件

林学概论 四川农业大学 林学概论课件 61阅读提醒您本文地址:
林学概论 四川农业大学 林学概论课件

林学概论 四川农业大学 林学概论课件

林学概论 四川农业大学 林学概论课件

林学概论 四川农业大学 林学概论课件

林学概论 四川农业大学 林学概论课件

林学概论 四川农业大学 林学概论课件

林学概论 四川农业大学 林学概论课件

林学概论 四川农业大学 林学概论课件

林学概论 四川农业大学 林学概论课件

林学概论 四川农业大学 林学概论课件

林学概论 四川农业大学 林学概论课件

林学概论 四川农业大学 林学概论课件

林学概论 四川农业大学 林学概论课件

林学概论 四川农业大学 林学概论课件

林学概论 四川农业大学 林学概论课件

林学概论 四川农业大学 林学概论课件

林学概论 四川农业大学 林学概论课件

林学概论 四川农业大学 林学概论课件

林学概论 四川农业大学 林学概论课件

林学概论 四川农业大学 林学概论课件

林学概论 四川农业大学 林学概论课件

林学概论 四川农业大学 林学概论课件

林学概论 四川农业大学 林学概论课件

林学概论 四川农业大学 林学概论课件

林学概论 四川农业大学 林学概论课件

林学概论 四川农业大学 林学概论课件

林学概论 四川农业大学 林学概论课件
林学概论 四川农业大学 林学概论课件

林学概论 四川农业大学 林学概论课件

61阅读提醒您本文地址:
林学概论 四川农业大学 林学概论课件

林学概论 四川农业大学 林学概论课件

林学概论 四川农业大学 林学概论课件

林学概论 四川农业大学 林学概论课件

林学概论 四川农业大学 林学概论课件

林学概论 四川农业大学 林学概论课件

林学概论 四川农业大学 林学概论课件

林学概论 四川农业大学 林学概论课件

林学概论 四川农业大学 林学概论课件

林学概论 四川农业大学 林学概论课件

林学概论 四川农业大学 林学概论课件

林学概论 四川农业大学 林学概论课件

林学概论 四川农业大学 林学概论课件

林学概论 四川农业大学 林学概论课件

林学概论 四川农业大学 林学概论课件

林学概论 四川农业大学 林学概论课件

林学概论 四川农业大学 林学概论课件

林学概论 四川农业大学 林学概论课件

林学概论 四川农业大学 林学概论课件

林学概论 四川农业大学 林学概论课件

林学概论 四川农业大学 林学概论课件

林学概论 四川农业大学 林学概论课件

林学概论 四川农业大学 林学概论课件

林学概论 四川农业大学 林学概论课件

林学概论 四川农业大学 林学概论课件

林学概论 四川农业大学 林学概论课件

林学概论 四川农业大学 林学概论课件

林学概论 四川农业大学 林学概论课件

林学概论 四川农业大学 林学概论课件

林学概论 四川农业大学 林学概论课件 61阅读提醒您本文地址:

林学概论 四川农业大学 林学概论课件

林学概论 四川农业大学 林学概论课件

林学概论 四川农业大学 林学概论课件

林学概论 四川农业大学 林学概论课件

林学概论 四川农业大学 林学概论课件

林学概论 四川农业大学 林学概论课件

林学概论 四川农业大学 林学概论课件

林学概论 四川农业大学 林学概论课件

林学概论 四川农业大学 林学概论课件

林学概论 四川农业大学 林学概论课件

林学概论 四川农业大学 林学概论课件

林学概论 四川农业大学 林学概论课件

林学概论 四川农业大学 林学概论课件

林学概论 四川农业大学 林学概论课件

林学概论 四川农业大学 林学概论课件

林学概论 四川农业大学 林学概论课件

林学概论 四川农业大学 林学概论课件

林学概论 四川农业大学 林学概论课件

林学概论 四川农业大学 林学概论课件

林学概论 四川农业大学 林学概论课件

林学概论 四川农业大学 林学概论课件

林学概论 四川农业大学 林学概论课件

林学概论 四川农业大学 林学概论课件

林学概论 四川农业大学 林学概论课件

林学概论 四川农业大学 林学概论课件

林学概论 四川农业大学 林学概论课件

林学概论 四川农业大学 林学概论课件

林学概论 四川农业大学 林学概论课件

林学概论 四川农业大学 林学概论课件

61阅读提醒您本文地址:
林学概论 四川农业大学 林学概论课件

林学概论 四川农业大学 林学概论课件

林学概论 四川农业大学 林学概论课件

林学概论 四川农业大学 林学概论课件

林学概论 四川农业大学 林学概论课件

林学概论 四川农业大学 林学概论课件

林学概论 四川农业大学 林学概论课件

林学概论 四川农业大学 林学概论课件

林学概论 四川农业大学 林学概论课件

林学概论 四川农业大学 林学概论课件

61阅读提醒您本文地址:
四 : 四川农业大学2014
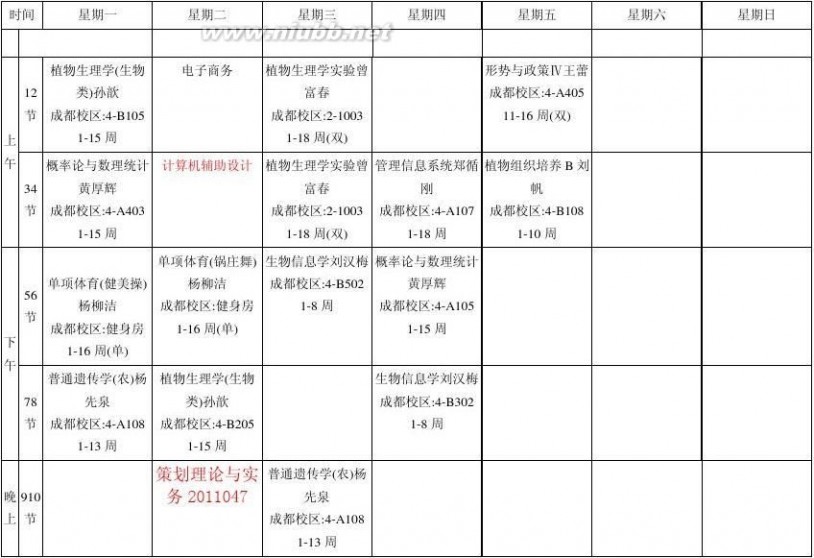
四川农业大学2013-2014-2学期理论课程表
生技201203
康莎莎(2013-12-30)
61阅读提醒您本文地址:
本文标题:四川农业大学-四川农业大学李明洲nature文章61阅读| 精彩专题| 最新文章| 热门文章| 苏ICP备13036349号-1